Hi-Stat Vox No. 15 (September 9, 2010)
New Avenues for Research on Household Expenditure Using Homescan Data
Naohito Abe
Associate Professor, Institute of Economic Research, Hitotsubashi University

The study of household consumption expenditure, particularly quantitative analyses of food expenditure patterns, has continued for many years. Indeed, Stigler (1954) discovered that the spending patterns of 127 households were surveyed in Great Britain at the end of the 18th century. In the 19th century, household expenditure data were gathered in many countries, including Belgium and Germany, and Engel presented his famous law. However, it was not until the 20th century, when long-term analysis based on aggregate macro data became possible, that household expenditure data were linked to modern economic theories. Although the 1930s saw the emergence of the famous “Consumption function controversy” raging among scholars such as Duesenberry, Friedman, Modigliani, and Kuznets, household-level survey data available at the time covered only a brief period, so that the analysis of long-term expenditure behavior had to rely on macro data.
The use of macro data for empirical studies on household expenditure continued in subsequent years, partly aided by the development of quantitative techniques in the 1980s by Hansen and Singleton (1983), Campbell and Mankiw (1989), and others. Even now, in the 21st century, macro household expenditure data are sometimes used for estimating the structural parameters of a macro model. These days, however, the overwhelming majority of studies on household expenditure are based on household-level micro data. Even in macroeconomic models during the 1980s, standard structural models of household expenditure were based on household lifecycle models incorporating uncertainty, justifying the use of macro data by setting strong assumptions such as perfect capital markets and Ricardian equivalence. Essentially, however, if long-term micro expenditure data are available, there are few benefits to using macro expenditure data, which are the aggregate values of personal expenditures of consumers that differ in many respects such as age, academic background, and occupation.
Micro expenditure data have become increasingly available since the late 1960s. The most notable of these is the Panel Study of Income Dynamics (PSID), a micro panel data set, which has been tracking household food expenditure since 1969. The first major study using the PSID for empirical analysis of household expenditure is that by Hall and Mishkin (1982). Although the PSID has been used in many studies since then, most research these days now relies on the Consumer Expenditure Survey (CEX) and the Family Expenditure Survey (FES). The reason is that the CEX and the FES cover almost all categories of consumption expenditure and allow the comprehensive analysis of expenditure behavior, while the PSID covers only food expenditure. However, as is well known, the CEX and the FES also have many shortcomings. With some exceptions, the CEX and the FES do not ask consumers to keep household accounts, but rely on recall, so that they contain considerable measurement error. Moreover, recent studies (e.g., Ahmed et al. 2006) indicate that the measurement error is negatively correlated with the true values, posing serious problems for regression analyses. An additional shortcoming of the CEX and FES is that they do not track the same households over time, so that long-term consumption series are on a cohort basis and hence aggregated (although it is possible to transform aggregate data into equivalent expenditure using micro data).
Since the start of the 21st century, economic analysis is conducted using not the PSID, the CEX, or the FES, but a new type of consumption data that deserves the title “ultimate micro data”: homescan data constructed by several marketing research firms such as ACNielsen. Homescan data are collected by providing households with a barcode reader and recording the number of particular items purchased, their price, and the store where they were bought, in households’ daily shopping. Homescan data are gathered around the world, and databases are being built not only in developed countries such as the United States, the United Kingdom, and Japan, but also in developing countries such as China, Indonesia, and India. Although homescan data are very expensive to collect, as can be easily imagined, the data are in demand as a valuable marketing tool given that they provide detailed purchase information on individual items. Although homescan data have been used mainly in the field of marketing science to analyze brand and store choices, in recent years they have also been increasingly employed in studies by economists.
While there are a number of economic studies using homescan, including the analysis of consumer inventory behavior by Hendel and Nevo (2006), the best known study is that by Aguiar and Hurst (2007) published in the American Economic Review. In this study, the authors developed a price index for each household using the homescan data set for Denver in the United States, constructed by ACNielsen, the global marketing research firm. The authors found that the older a household, the lower was the purchase price of the same items, and that there was a strong negative correlation between the frequency of purchase and purchase prices. Given that older retired households tend to spend more time on shopping than young and middle-aged households, this finding suggests that there is a simple trade-off between the opportunity cost of shopping and finding the lowest prices. This is a good example of how, in contrast with the PSID and the CEX, which only provide information on households’ total expenditure, the availability of information on how much households actually pay for individual items, allows for a more detailed and accurate analysis of household expenditure behavior.
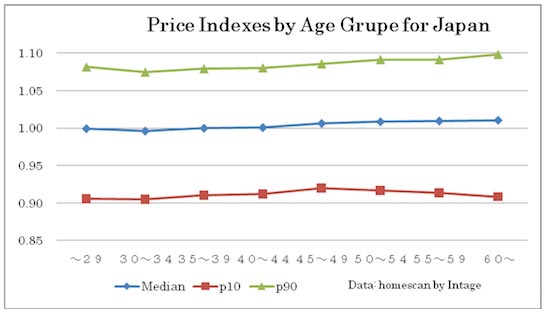
The model developed by Aguiar and Hurst (2007) considers extremely general household behavior. This raises the question: Can the same pattern that the older a household, the lower the price of items purchased also be observed in Japan? The figure below, using homescan data for Japan, plots household price indexes by age group following the same methodology as Aguiar and Hurst (2007). The horizontal axis shows the relative price level to the national average. If the price level for a household is 1.1, this means the household purchases goods at greater prices than the national average by ten percent. It is because the price level is calculated at household level. It is also possible to observe the distribution of the price index. The figure also shows the price index faced by households at 10th percentile and 90th percentile as well as the median. It shows that purchase prices actually rise, albeit moderately, with household age. What is more, to my knowledge, studies on other countries using homescan data also do not replicate the result obtained by Aguiar and Hurst (2007). A natural interpretation thus is that the relationship between household age and purchase prices is more complex than suggested by the simple and elegant model of Aguiar and Hurst (2007). It is therefore necessary to construct lifecycle models of expenditure that incorporate other factors such as store choice and the frequency of purchases at sales, which is a challenge currently faced by all researchers using homescan data.
Another interesting direction for research is to conduct studies using information on the calories in and nutritional balance of purchased food items, taking advantage of the fact that homescan provides data on individual items. Given that in Europe and the United States poorer households tend to have higher rates of obesity, a likely explanation is that low-priced goods tend to be high in calories. By expanding the database of homescan and examining the rate of obesity in surveyed households, it would be possible to quantitatively examine the relationship between poverty and caloric intake.
Another key feature of homescan data, apart from the fact that it contains data on individual items, is that it is a long-term panel of daily data since it surveys the same households for several years. In contrast to the PSID and the CEX, which survey households only once a year and once a quarter, respectively, homescan is a long-term panel data with extremely high frequency. This means that it is possible to examine household inventory behavior and test hypotheses on consumer habit formation, which was very difficult to do with micro data in the past. Naturally, since homescan has been used for the analysis of expenditure patterns only for a relatively short time, the peculiarities, advantages, and shortcomings of the data are still unclear. However, just as the PSID in the 1980s made possible the empirical analysis of theories of household consumption based on micro-data, homescan could herald the arrival of a new era in household consumption analysis. Although micro data collected through homescan technology is currently only available to economists in the United Kingdom, France, the United States, and Japan, it is expected to become available in more countries in the years ahead, including developing nations. It looks almost certain that we will gain a better understanding of cultural differences in household consumption behavior as well as the common mechanisms behind them. I hope that the research based on Japanese homescan will occupy a primary position in these developments.
References
Aguiar, M. and E. Hurst (2007) “Lifecycle Prices and Production,” American Economic Review, Vol.97, No.5, pp.1533-1559.
Ahmed, N., M. Brzozowski, and T.F. Crossley (2006) “Measurement Errors in Recall Food Consumption Data,” IFS Working Paper, W06/21.
Campbell, J.Y. and N.G. Mankiw (1989) “Consumption, income and interest rates: reinterpreting the time series evidence,” in: O.J. Blanchard and S. Fischer, eds., NBER Macroeconomics Annual 1989 (MIT Press, Cambridge, MA) 185-216.
Hall, R. and F.S. Mishkin (1982) “The Sensitivity of Consumption to Transitory Income: Estimates from Panel Data on Households,” Econometrica, Vol.50, No.2, pp.461-481.
Hansen, L.P. and K.J. Singleton (1983) “Stochastic Consumption, Risk Aversion, and the Temporal Behavior of Asset Returns,” The Journal of Political Economy, Vol.91, No.2, pp.249-265.
Hendel, I. and A. Nevo (2006) “Measuring the Implications of Sales and Consumer Inventory Behavior,” Econometrica, Vol.74, No.6, pp.1637-1673.
Stigler, G. (1954) “The Early History of Empirical Studies of Consumer Behavior,” The Journal of Political Economy, Vol.62, No.2, pp.95-113.