Hi-Stat Vox No. 8 (May 18, 2009)
Why Is Japan So Heavily Affected by the Global Economic Crisis? – An Analysis Based on the Asian International Input-Output Tables
Kyoji Fukao
Professor, Institute of Economic Research, Hitotsubashi University
Tangjun Yuan
Associate Professor, Institute of Economic Research, Hitotsubashi University

Although Japan has not suffered a collapse in real estate prices or large problems with regard to bad assets, Japan’s economy in some respects has been affected even more severely by the current global economic crisis than the economies of the United States and Europe. For example, the quarter-on-quarter contraction in real GDP during the final quarter of 2008 in Japan at 12.1% was much greater than the 6.3% contraction experienced by the United States.1 Looking at the contribution of individual demand components to this contraction, what stands out in the case of Japan is that the steep drop in external demand (net exports) accounts for 11.8 percentage points and thus explains almost all of the contraction overall. (The contribution of the drop in external demand breaks down into -10.0 percentage points due to a decline in exports and -1.8 percentage points due to an increase in imports.) In contrast, for the United States, the negative contribution of the decline in external demand (net exports) was only 0.15 percentage points (which breaks down into a -3.44 percentage-point contribution from a decrease in exports and a +3.29 percentage-point contribution from a decrease in imports), meaning that the contraction in GDP was brought about almost entirely by a drop in domestic demand.
As these figures show, by far the most important reason for the contraction in Japan is the large decrease in external demand (particularly the drop in exports). The following are some of the main factors why Japan experienced such an exceptionally serious decline in overseas demand, including from the United States.
1. Contraction in triangular trade
Until the economic crisis, there was vigorous so-called triangular trade in which the advanced economies of Asia, such as Japan, South Korea, and Taiwan, export key components to developing countries, such as China, Thailand, or Vietnam, where these are then assembled and exported to the United States (and Europe) in return for U.S. Treasuries. Under this triangular trade, the developing countries of Asia specialize in relatively low value-added assembly and manufacturing processes, while the advanced countries of Asia such as Japan concentrate on high-value added processes such as the production of key components. However, it appears that as a result of the sudden decrease in U.S. imports, this triangular trade has contracted very rapidly. On a national accounts basis, U.S. goods imports during the last quarter of 2008 fell at an annual rate of 19.6%. And as the exports of Asian developing countries to the United States decreased, so their imports from Japan, South Korea and Taiwan also decreased. Thus, Japan, South Korea and Taiwan suffered not only a decline in exports to the United States, but also in exports of key components to developing countries in Asia, and this is likely to be one reason that the impact of the global downturn on Japan has been so great.
2. A shift in the global demand structure
A large share of Japan’s exports consists of capital and durable consumer goods such as cars, electric machinery, and machine tools, as well as key components for these goods. It is very likely that investment in plant and equipment, as a consequence of what is known as the “acceleration principle,” suffered a particularly steep decline due to the downturn in the world economy. At the same time, households, too, have been holding back purchases of durable consumer goods because of pessimistic views of the future and liquidity constraints, and consumer demand has shifted from high-end items to inexpensive goods, as illustrated by the boost in sales experienced by firms such as Wal-Mart and Uniqlo. Yet, as research on intra-industry trade – i.e., trade based on differences in unit costs reflecting the vertical division of labor – shows, Japan specializes in the production of high-end items.2 For the various reasons listed here, the disruption and shift in global demand appears to have hurt Japan’s exports particularly badly.
3. A lag in the timing of the recession
With the global recession propagating to Japan mainly through trade, Japan’s economy was affected only relatively late, but – due to this lag – with greater severity. Until the fourth quarter of 2008, Japan’s exports had remained largely unchanged, and when they did drop, the negative impact on GDP was particularly large. However, this also means that from the first quarter of 2009 onward, the negative impact of external demand on GDP growth is likely to diminish.
4. The impact of yen appreciation
As the global economic crisis escalated, the yen appreciated rapidly. If we set the 2007 average of the real effective exchange rate of the yen to 100, then it registered a rapid appreciation to 106 in September 2008, 118 in October, 127 in November, 135 in December, and 136 in January 2009. This appreciation of the yen contributed to the decline in exports. However, given that the rapid appreciation of the yen only began in September 2008 and that there is typically quite a time lag until an appreciation of the yen has an impact on net exports on a national accounts basis, it is unlikely that it greatly contributed to the sudden drop in exports in the fourth quarter of 2008.
The third and fourth points relate to mechanisms well known in open economy macroeconomics that are nothing new. However, the first two points concern new phenomena that are likely to attract the attention of many researchers of international economics. Here, we are going to focus on the first point and attempt to estimate the impact of the contraction in triangular trade using the “Asian International Input-Output Tables” (“Asian I-O Tables”) of the Institute of Developing Economies.
The Asian I-O Tables have been compiled for the analysis of inter-industry linkages through trade in the 10 countries of Japan, China, South Korea, Taiwan, Singapore, Thailand, Malaysia, Indonesia, the Philippines, and the United States. Products of the same industry are treated as different goods if they are produced by different countries (this type of I-O table is called a non-competitive import-type I-O table), and from these tables, it is possible to determine, for example, the input in China’s automotive industry of metal products made in Japan or South Korea.
In our calculation, we make the Keynesian assumption that final demand and its derived demand determine the level of production in each country. Based on this assumption, we can estimate – using the Asian I-O Tables – the effect of a decrease in triangular trade, for instance, a situation where a decline in U.S. final demand brings about a decline in production in China and Vietnam, which in turn results in a decrease in Japan’s intermediate goods exports. To conduct such a calculation, a table called a Leontief inverse matrix is required, but fortunately this is available in the Asian I-O Tables for 24 industries and the 10 countries mentioned.
For the exercise here, we estimate the change in trade and production for the 10 countries for the case of a 1% decrease in U.S. final demand for the products of all 10 countries, including the United States itself. The final demand of the other 9 countries is assumed to remain unchanged. We also suppose that the value of trade of the 10 countries with the rest of the world remains unchanged.3 Unfortunately, the latest available edition of the Asian I-O Tables is from 2000 and therefore somewhat dated. While this cannot be helped, we did use the Trade Industry Database published by the Research Institute of Economy, Trade and Industry (RIETI-TID) and statistics from the U.S. Bureau of Economic Analysis for 2007 in order to replicate as closely as possible the structure of U.S. final demand by producer country and industry just before the global economic crisis.
The decrease in U.S. final demand itself will decrease Asian countries’ exports serving U.S. final demand. At the same time, because the decrease in U.S. final demand will also decrease U.S. intermediate goods inputs, Asian countries’ exports for U.S. intermediate input use will also fall. Moreover, because production in the Asian countries decreases, the trade in intermediate goods among the 10 countries, including the United States, will decrease further.
Figures 1 and 2 show the results of our simulation for Japan and China based on the Asian I-O Tables. Specifically, the figures depict the impact of a 1% decrease in U.S. final demand on Japan’s (China’s) net exports (i.e., exports minus imports) of intermediate goods by trading partner.
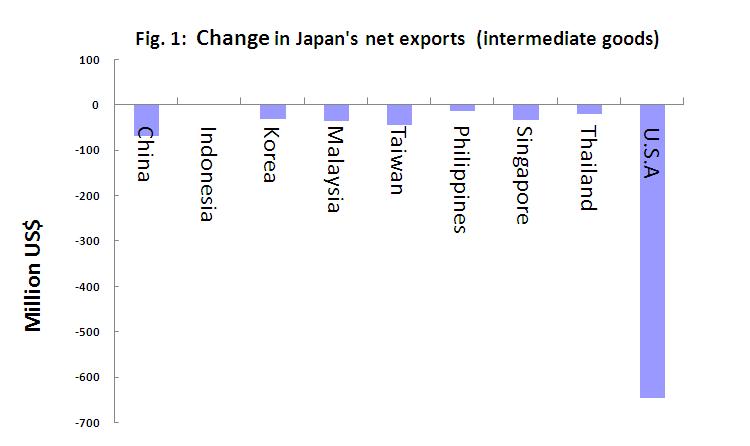
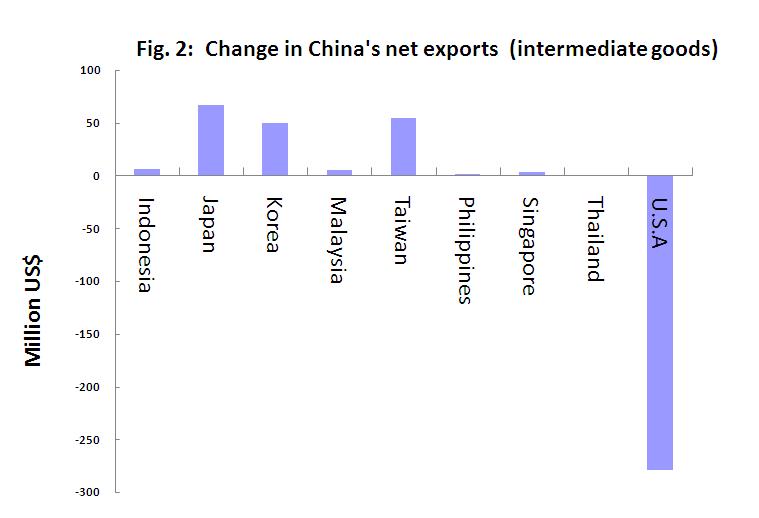
These figures clearly show the effects of a contraction in triangular trade. In the case of Japan, the largest fall in net exports in intermediate goods is observed in exports to the United States, but net exports of intermediate goods to the Asian countries, including China, also decrease. On the other hand, in the case of China, net exports of intermediate goods to the United States also fall substantially, but because China’s imports of intermediate goods from other Asian countries, including Japan, decline,4 net exports to these countries actually increase. This comparison shows that the impact on Japan of a contraction in triangular trade due to a decrease in U.S. demand is greater than the drop in exports to the United States alone, while the opposite is the case for China.
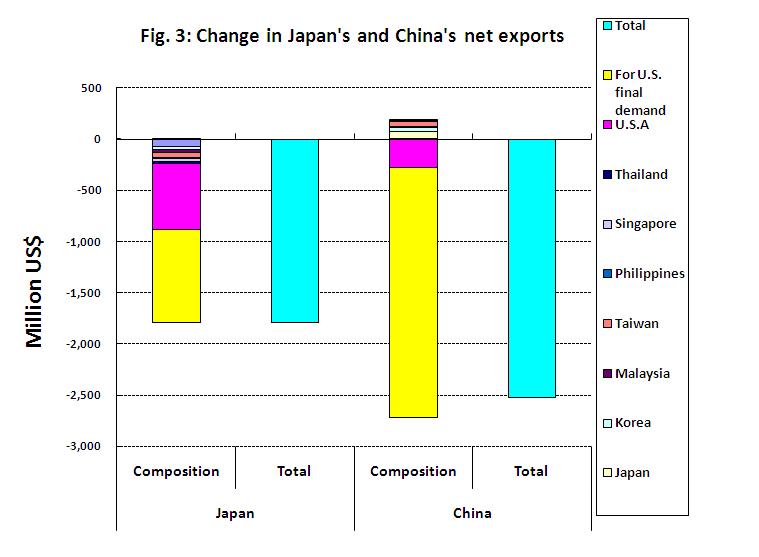
Next, Figure 3 shows the change in net exports by partner country for Japan and China including not only the trade in intermediate goods but also the trade in final goods. Looking first at net exports of intermediate goods, the figure shows that, as already seen above, the contraction in net exports to the United States is much greater for Japan than for China, simply because the value of Japan’s exports of intermediate goods to the United States are much greater, and also because of the impact of the contraction in triangular trade. However, turning to final goods exports, China’s exports to the United States are actually considerably greater than Japan’s, and as a result, China faces a much greater decrease in total net exports than Japan.
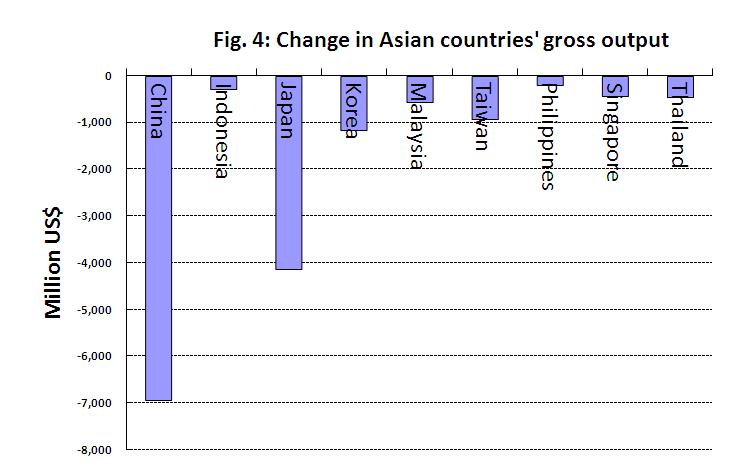
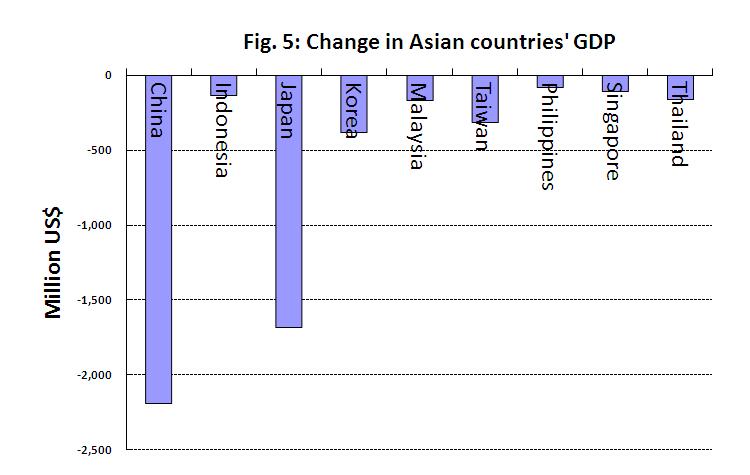
Finally, Figure 4 compares the impact on gross output and Figure 5 that on GDP for the Asian countries. Reflecting the large decrease in exports, the drop in China’s gross output is 1.7 times as large as Japan’s. However, the difference in the impact on GDP is considerably smaller: the decrease in China’s GDP is only 1.3 times as large as Japan’s. This situation is also the result of triangular trade. China is relatively specialized in the processing and assembly of imported intermediate goods using cheap labor, and the products are then exported to the United States. However, the value added ratio of this kind of production is typically low, and it is for this reason that the decrease in GDP is smaller than the decrease in gross output. Figure 5 also shows that, after China and Japan, the countries facing the greatest contraction in GDP are South Korea and Taiwan.
Let us summarize the results of the analysis. Using Asian I-O Tables, we calculated the impact of a decrease in U.S. final demand on Asian trade and Japan’s and China’s GDP, illustrating the effects of a contraction in triangular trade. Because intermediate input decreases not only in the United States but also in the Asian countries, Japan, which exports large amounts of intermediate goods, experiences a decline in net exports to Asian countries. China, on the other hand, imports large amounts of intermediate goods and – reflecting the substantial contraction in domestic production due to the large decrease in exports for final demand in the United States – experiences an increase in net exports of intermediate goods to Asian countries, including Japan. In addition, we found that because the value added ratio of export production in China is low, the drop in China’s GDP is relatively small when compared with the fall in production.
It is important to note that the discussion here considers only the effects of a contraction in triangular trade. Comparing actual U.S. imports by partner country (on a U.S. dollar basis) in 2007 and 2008, we find that imports from Japan fell by 19%, while those from China decreased only by 5%. This means that in order to sufficiently understand the large impact of the downturn in the United States and worldwide on Japanese exports, it is necessary to also take into account other factors such as global demand for investment goods and durable consumer goods and a possible shift away from high-end goods.
Yet another aspect is that the driving force behind triangular trade is multinational corporations (MNCs). MNCs account for about half of China’s exports to the United States, and it is MNCs that tend to be especially dependent on imports of key components. It is possible that the contraction in triangular trade has an especially large impact on Japan and Korea because it particularly affects the production of MNCs. Unfortunately, this is an issue that it is difficult to examine with the Asian I-O Tables, as these do not provide information that would make it possible to distinguish between MNCs and local independent firms in the analysis of inter-industry linkages.
Refining our analysis, taking into account the role of shifts in global demand for different types of goods, and examining the role of MNCs represent important research tasks for the future.
References
Fukao, and Tangjun Yuan (2007) “Is China Gaining from Triangular Trade? An Analysis Based on Asian International Input-Output Tables,” in Yosuke Noda and Masato Kuroko (eds.), Trade-Related Indices and Trade Structure, IDE Statistical Data Series No.91, Institute of Developing Economies (in Japanese).
Fukao, Kyoji, Hikari Ishido and Keiko Ito (2003) “Vertical Intra-Industry Trade and Foreign Direct Investment in East Asia,” Journal of the Japanese and International Economies, Vol.17, December 2003, pp.468-506.
1 Seasonally adjusted annualized rates. Second preliminary estimate in the case of Japan; final estimate in the case of the United States.
2 For details on this point, see Fukao et al. (2003).
3 The framework is based on Fukao and Yuan (2007), where we used the Asian I-O Tables to examine triangular trade, except that for our purposes here, we consider the impact of a drop in U.S. final demand.
4 Considered here, for the time being, is only the effect of the drop in net exports of intermediate goods to the United States. However, as will be discussed later, an additional contributing factor is the large drop in production in China through the decline in Chinese exports for U.S. final demand use, which further reduces Chinese imports of intermediate goods.